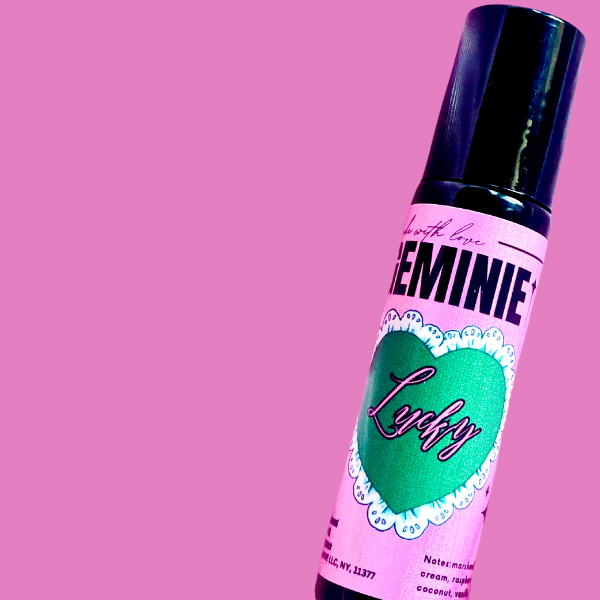
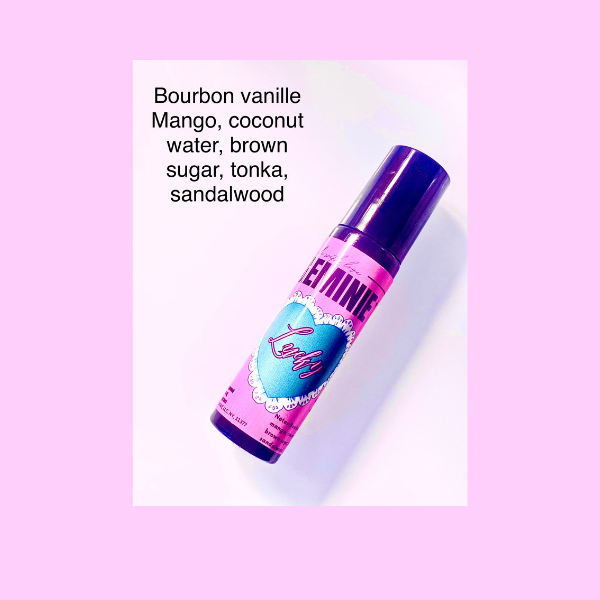
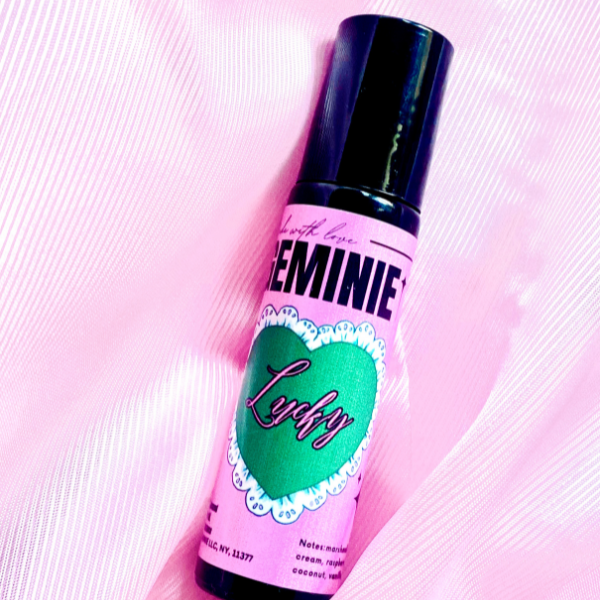
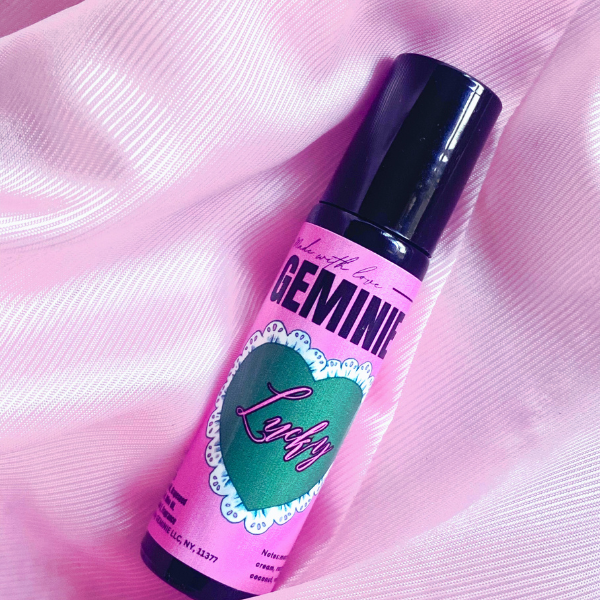
This is an absolute dream of a light, bright, beautiful gourmand. Lucky is so bright and sparkly. The opening is an intoxicating burst of the bourbon vanilla, mango, and coconut water, creating a luscious, almost tropical sweetness that’s rich yet airy. There’s a sparkling vibrancy from the matcha, adding a touch of brightness that keeps the scent from ever feeling too heavy. It smells like a straight up bakery, but not overwhelmingly sweet at all. The vanilla is perfectly delectable and the matcha grounds it to create a gorgeous unique cloud like scent.
To use the product, apply it to pulse points such as temples, wrist, neck, and behind the ears. Repeat when the scent starts to fade throughout the day. It is recommended to perform a patch test on a small area of skin to check for adverse reactions before regular use.